

On November 3, 2026, the Analytics page in the Fours console stopped loading Apache Superset. By then, more than 300 customer dashboards across more than 100 customer organizations had moved to Insulin Apps. No customer had to rebuild one. The page itself is now an app.
We replaced one of our products with our own AI. The expensive step had been finding someone who could write SQL against our schema.
Why were our Superset dashboards so expensive to keep?
Superset drew good charts, but every dashboard relied on hand-written SQL over our internal tables. Building or changing one took an engineer who knew the schema, and a data change could break it.
A nightly Spark job copies 29 tables from our product databases into an analytics database, and Superset read those tables. Each view needed a SQL dataset, charts built on that dataset, a dashboard to hold the charts, and permissions for all of it. We embedded the result in the console with a guest token for each organization. Customers who wanted their own chart had to learn a separate analytics workspace.
Over two years, the same costs kept coming back:
- Only engineers could build dashboards. Building a dataset meant knowing what each of the 29 tables held and how they joined. Customers asked us for charts, and someone on our team wrote them.
- One new field meant three changes. Adding a column to a chart meant changing the ETL job, the dataset, and the chart.
- Data changes could break dashboards already in use. On October 27, 2026, customers charting entitlements got “Network Error”. The ETL had started publishing an amount column as text, and Superset’s sum over it failed. Fixing the ETL was only part of the work. Someone also had to open Superset and run Sync columns from source on the dataset. In March, month filters had been dropping rows at month boundaries until we cast timestamps to dates in every pipeline.
- Organization separation was ours to handle. Superset has no idea what a Fours organization is. Per-organization access came from our patched build. When we tried sending chart data through Superset’s API, an upstream bug, Superset issue #26201, stopped the guest token from scoping it, so we wrote the organization filter by hand and guarded it in CI. Guest tokens brought their own bugs: a cache mismatch in May, and in September, dashboards left open for a long time started returning 401 once their cached token expired.
- A dashboard could only show information. Superset could tell you how many offers were waiting on buyers. Following up happened in another tab. It wasn’t built for buttons that act on the rows.
What replaced it?
An analytics engine inside Fours that takes typed queries instead of SQL. The dashboards on top of it are apps, built by asking for them.
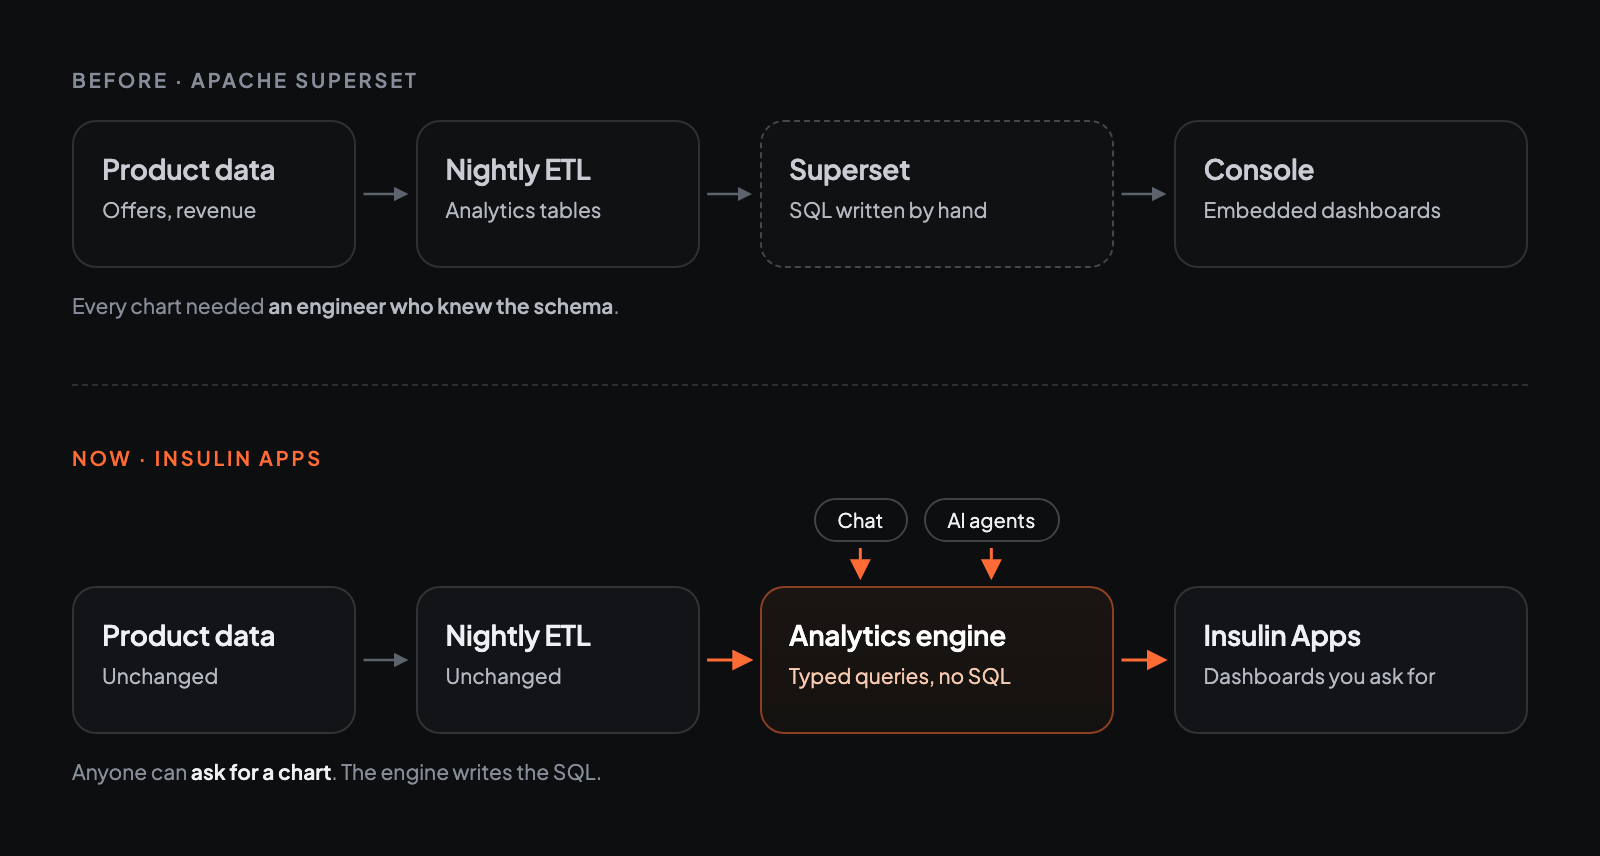
The engine reads the same nightly tables Superset read, so the numbers are exactly as fresh as they were. It changes how those results reach the screen:
- Queries describe the question, not the SQL. A query names a dataset, its measures, grouping, and time range. The engine checks it before it reads anything. If it does not hold together, it is refused with an explanation and usually a fix. The engine writes the SQL, and every value is a bound parameter.
- Eight datasets with named measures. Revenue, offers, entitlements, products, buyers, co-sell referrals, leads and AWS billing events. “Net revenue” and “win rate” are defined once in the model, rather than once per chart.
- Isolation lives in one place. Every table the engine reads carries the organization filter, and it reads through a read-only database role with row-level security. There is no patched build or hand-written clause.
- Schema changes reach us first. The model’s columns come from the ETL’s captured schema, and the engine checks for drift when it starts. That is where we want to learn that a column changed.
- Results are cached against the data version. A repeated question comes from the cache for up to a day. A new publish changes the version, so a cached answer is never older than the data behind it.
People can ask in chat, for example “chart private offers accepted by month, by partner”, and save the chart or dashboard for their organization. They can connect their own AI agent to the Fours MCP server, which has 21 analytics tools. For something beyond a dashboard, they can describe it to the AppBuilder and get an app that uses the services their organization has connected, such as Salesforce or HubSpot, each granted to the app on its own.
How did 300 dashboards move without anyone rebuilding them?
By script, not by model. It read each dashboard and chart from Superset’s API, translated it, and before an organization switched over, someone compared its key numbers with Superset’s.
- Export. We pulled dashboard and chart definitions from Superset’s REST API.
- Sort. The standard dashboards every organization had became built-in copies. Customer-authored charts went through a translator.
- Translate. The translator is deterministic, with no model in the loop. The same chart always produces the same result.
- Reconcile. For each organization, we compared the key figures with Superset’s before committing anything.
The first comparisons were poor. In July, our numbers read two to three times Superset’s, which traced back to six separate bugs. Some differences were not bugs: Superset’s “Current Quarter” is not the same as “the last 90 days”, and pivot tables needed a fix to the table widget before they matched. The three built-in dashboards, Finance, Private Offer and Co-Sell, are copies of Superset’s, edited by hand to keep its titles, layout, filters and defaults. When we checked them against Superset on test data on November 10, every chart matched except in two ways: amounts are now converted to US dollars, and one pie chart breaks a tie differently.
What does a migrated dashboard look like?
Much like the old one. The built-in Private Offer dashboard keeps Superset’s layout and filters, shown here with sample data.
An organization admin turns it on once. Set up Analytics on the Analytics page creates a console-only app, shares it with everyone in the organization, adds the three built-in dashboards, and publishes it. Each dashboard opens with its filters. Clicking a bar or slice filters the other charts. Each chart’s menu has Show rows, which lists the records behind it, Download CSV, and Full screen. The link keeps the filters you set, so sharing it preserves the same view.
What got better?
Building a dashboard now starts with a sentence in chat, not a ticket for an engineer. One engine answers every surface, so the numbers agree.
- Anyone can build one. Ask for a chart in chat and save it. Saving or changing one needs the Admin or Editor role.
- The same numbers everywhere. Chat, Slack and Teams, an AI agent over MCP, and the dashboards all query one engine. Ask in chat what last quarter’s revenue was and the answer comes from the same measure as the chart, as far as your role allows.
- Fewer moving parts in the console. The console no longer loads Superset’s embedding SDK, and dashboards no longer depend on guest tokens.
- Dashboards can grow into tools. A dashboard that shows 17 offers waiting on buyers can become an app that does something about them. The difference between a custom app and a dashboard is mostly whether the person looking needs to act next.
- Faster, in our experience. Repeat views come from the cache. We haven’t published a benchmark, so take this as what we have seen, not a measurement.
What did we give up?
Free-form SQL, mostly, along with a few things the engine doesn’t cover yet.
- No free SQL and no custom datasets. A question that needs data outside the eight datasets means a change to the model, and that change is ours to make.
- Still nightly. The engine reads what the ETL published last night, not live records.
- No usage-metering dataset yet. Metered usage isn’t one of the eight.
- One view for the whole organization. The Analytics app reads with its own access, so every member sees every saved dashboard and the figures behind it, revenue included, whatever their role allows elsewhere. Save a dashboard there only if everyone may see it.
We made a similar trade for our tickets (how we replaced ClickUp with GitHub Issues) and our cap table (how we replaced Pulley). In both cases, we were paying for a general tool and using a narrow part of it.
Where does Insulin come in?
The dashboards are Insulin apps, and the builder that makes them can also make apps that do more than show numbers. If your organization used the old Analytics page, its dashboards are already in Insulin Apps. To build a new one, describe it in chat or in Insulin Apps. To check what a generated dashboard actually counts before relying on it, see how to verify an AI-generated dashboard.
Sources
Primary sources for the platform rules cited above. Last verified November 16, 2026. Providers change their products, prices and terms without notice — check the source before relying on a detail.
- Fours docs: Analytics — That the Analytics page runs the organization's Analytics app; one-click setup by an organization admin (create a console-only app, share it with everyone, add the built-in dashboards, publish); the three built-in dashboards copied from the old page's standard dashboards; Show rows, Full screen and Download CSV on each chart; that every member sees every saved dashboard and its figures; and that the dashboards migrated from the old Analytics page are in Insulin Apps
- Fours Insulin docs: Insulin Apps — That the legacy Analytics dashboards are retired and the migrated dashboards are apps in Insulin Apps; that new dashboards are built by describing them in plain language
- Fours Insulin docs: Charts and dashboards from your Fours data — That the Insulin assistant answers questions about figures by querying the organization's analytics, as the asker's role allows, in Slack and Teams too; and that it saves, changes and deletes charts and dashboards for the organization, with the Admin or Editor role
- Fours MCP server: Analytics tools — The eight datasets; that a query is a structured document, not SQL, checked before any data is read; the 21 Analytics tools; that queries read the analytics data Fours publishes, not live records
Keep reading
Stay Updated
New posts, product updates and marketplace strategy are shared on LinkedIn as they publish.
Follow Fours on LinkedIn